Tổng quan
Dự án này triển khai một high-availability microservices trên Kubernetes, sử dụng K3s - một phiên bản Kubernetes nhẹ, tối ưu cho bare-metal.
Google’s Online Boutique - một ứng dụng microservices gồm 11 services độc lập giao tiếp với nhau thông qua gRPC, từ cơ sở dữ liệu đến frontend.
Kiến trúc tổng thể
Internet
   │
   ├──> Tailscale VPN (Mesh Network)
   │
   └──> Proxmox VE (KVM Hypervisor)
            │
            ├──> VM 1: K3s Control Plane (etcd + API Server)
            │        │
            │        └──> NodePort: 30080 (Frontend)
            │
            ├──> VM 2: K3s Worker Node 1
            │        └──> 5-6 microservice pods
            │
            └──> VM 3: K3s Worker Node 2
                     └──> 5-6 microservice pods

Monitoring Stack:
   └──> Prometheus + Grafana (Helm-deployed)
            └──> Real-time metrics cho tất cả pods & nodes
Công nghệ sử dụng
- K3s - Kubernetes nhẹ, triển khai nhanh
- Docker - Container runtime
- Proxmox VE - Hypervisor KVM để tạo VM
- Ubuntu Server - OS cho tất cả các node
- Tailscale - VPN mesh giải quyết AP isolation
- Prometheus - Metrics collection
- Grafana - Visualization & dashboards
- Helm - Package manager cho Kubernetes
- gRPC - Communication protocol giữa microservices
Thách thức: AP Isolation
Mạng WiFi tại nhà bật AP isolation, ngăn các thiết bị trong cùng mạng giao tiếp với nhau. Điều này gây khó khăn lớn cho:
- SSH access vào các VM từ laptop
- Truy cập Proxmox dashboard
Giải pháp: Tailscale VPN Mesh
Kết quả:
- Tất cả nodes có thể SSH trực tiếp qua Tailscale IP
- Kubernetes pods communicate được qua mạng VPN
- Không expose services ra public internet
- Không cần thay đổi router config
Triển khai Multi-Node K3s Cluster
Bước 1: Provision VMs trên Proxmox
Tạo 3 VMs Ubuntu Server:
- VM 1 (2 vCPU, 4GB RAM): K3s Control Plane
- VM 2 (2 vCPU, 4GB RAM): K3s Worker Node 1
- VM 3 (2 vCPU, 4GB RAM): K3s Worker Node 2
# Trên Control Plane node
curl -sfL https://get.k3s.io | sh -s - --cluster-cidr=10.244.0.0/16

# Trên Worker nodes, lấy token từ control plane:
curl -sfL https://get.k3s.io | sh -s - --server https://<control-plane-ip>:6443 --token <token>
Bước 2: Deploy Google Online Boutique
Google Online Boutique là microservices application với 11 services:
frontend- Web UI (Go)cartservice- Giỏ hàng (C#/ASP.NET)checkoutservice- Thanh toán (Go)productcatalogservice- Danh mục sản phẩm (Go)recommendationservice- Gợi ý sản phẩm (Python)shippingservice- Vận chuyển (Go)emailservice- Gửi email (Python)paymentservice- Xử lý thanh toán (Node.js)currencyservice- Chuyển đổi tiền tệ (Node.js)redis-cart- Redis cache cho giỏ hàngloadgenerator- Traffic generator (Python)
# Deploy với kubectl
kubectl apply -f ..../manifests/ ( sau khi đã clone repo về)


Kubernetes scheduler **tự động phân bổ** 11 pods cho 2 worker nodes dựa trên CPU/memory available.
Lưu ý: Nếu không setup taint thì scheduler cũng sẽ phân bổ pods cho master/control node
Bước 3: Expose Frontend với NodePort
Trong môi trường bare-metal (không có cloud load balancer), dùng NodePort service:
apiVersion: v1
kind: Service
metadata:
  name: frontend
spec:
  type: NodePort
  selector:
    app: frontend
  ports:
    - port: 80
      targetPort: 8080
      nodePort: 30080
Truy cập frontend: http://<any-node-ip>:30080
Kube-proxy tự động route requests từ bất kỳ node nào trong cluster đến frontend pod.
Monitoring với Prometheus & Grafana
Cài đặt qua Helm
Tạo namespace riêng cho monitoring:
kubectl create namespace monitoring
Cài đặt kube-prometheus-stack:
helm repo add prometheus-community https://prometheus-community.github.io/helm-charts
helm repo update
helm install prometheus prometheus-community/kube-prometheus-stack -n monitoring
Stack bao gồm:
- Prometheus Operator - Quản lý Prometheus instances
- Prometheus - Metrics collection
- Alertmanager - Quản lý alerts
- Grafana - Dashboards với pre-configured panels
- Node Exporter - Host-level metrics
- kube-state-metrics - Kubernetes object metrics
Observability đạt được
Dashboard Grafana hiển thị real-time:
| Metric | Source | Detail |
|---|---|---|
| CPU Usage | Pod-level | Từng microservice container |
| Memory Consumption | Pod-level | RAM usage của từng service |
| Network I/O | Node & Pod | Traffic giữa services qua gRPC |
| Request Rate | Frontend | HTTP requests/second |
| Error Rate | All services | 5xx responses theo service |
So với monitoring ở hypervisor level (Proxmox), cấp độ pod-level metrics cung cấp visibility sâu hơn vào ứng dụng microservices.
Tính năng High-Availability
1. Multi-Node Cluster
- Control Plane HA: etcd cluster với 3 nodes (trong demo này dùng single control plane nhưng có thể scale)
- Worker Nodes: 2 nodes, Kubernetes scheduler tự động reschedule pods nếu node fail
2. Self-Healing
# Kiểm tra pods được tự động restart nếu crash
kubectl get pods -w

# Nếu worker node 1 die, pods được lên lại trên worker node 2
kubectl delete node <worker-node-1>
# Watch: pods bị disrupted → tạo lại trên node khác
Demo Pictures
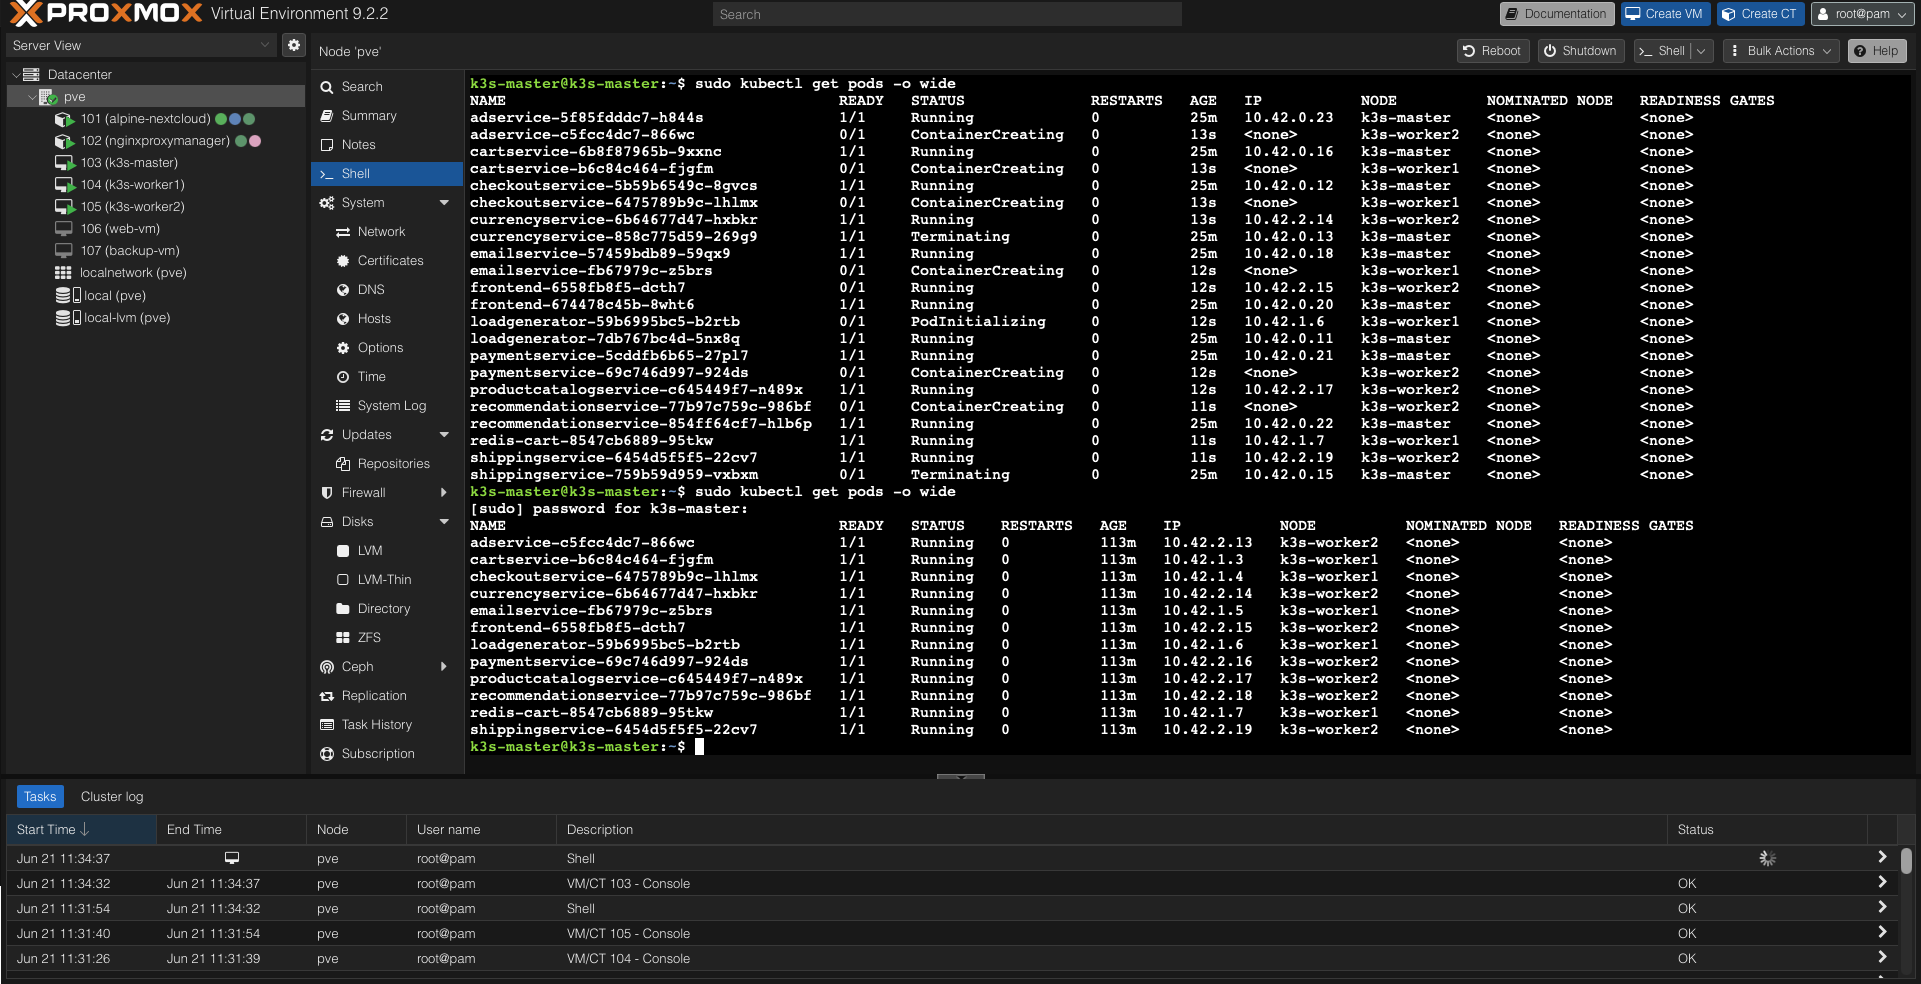 *K3s cluster architecture with 3 VMs on Proxmox* -->
 *Pods distributed across 2 worker nodes by Kubernetes scheduler*
---
*Pods distributed across 2 worker nodes by Kubernetes scheduler*
---
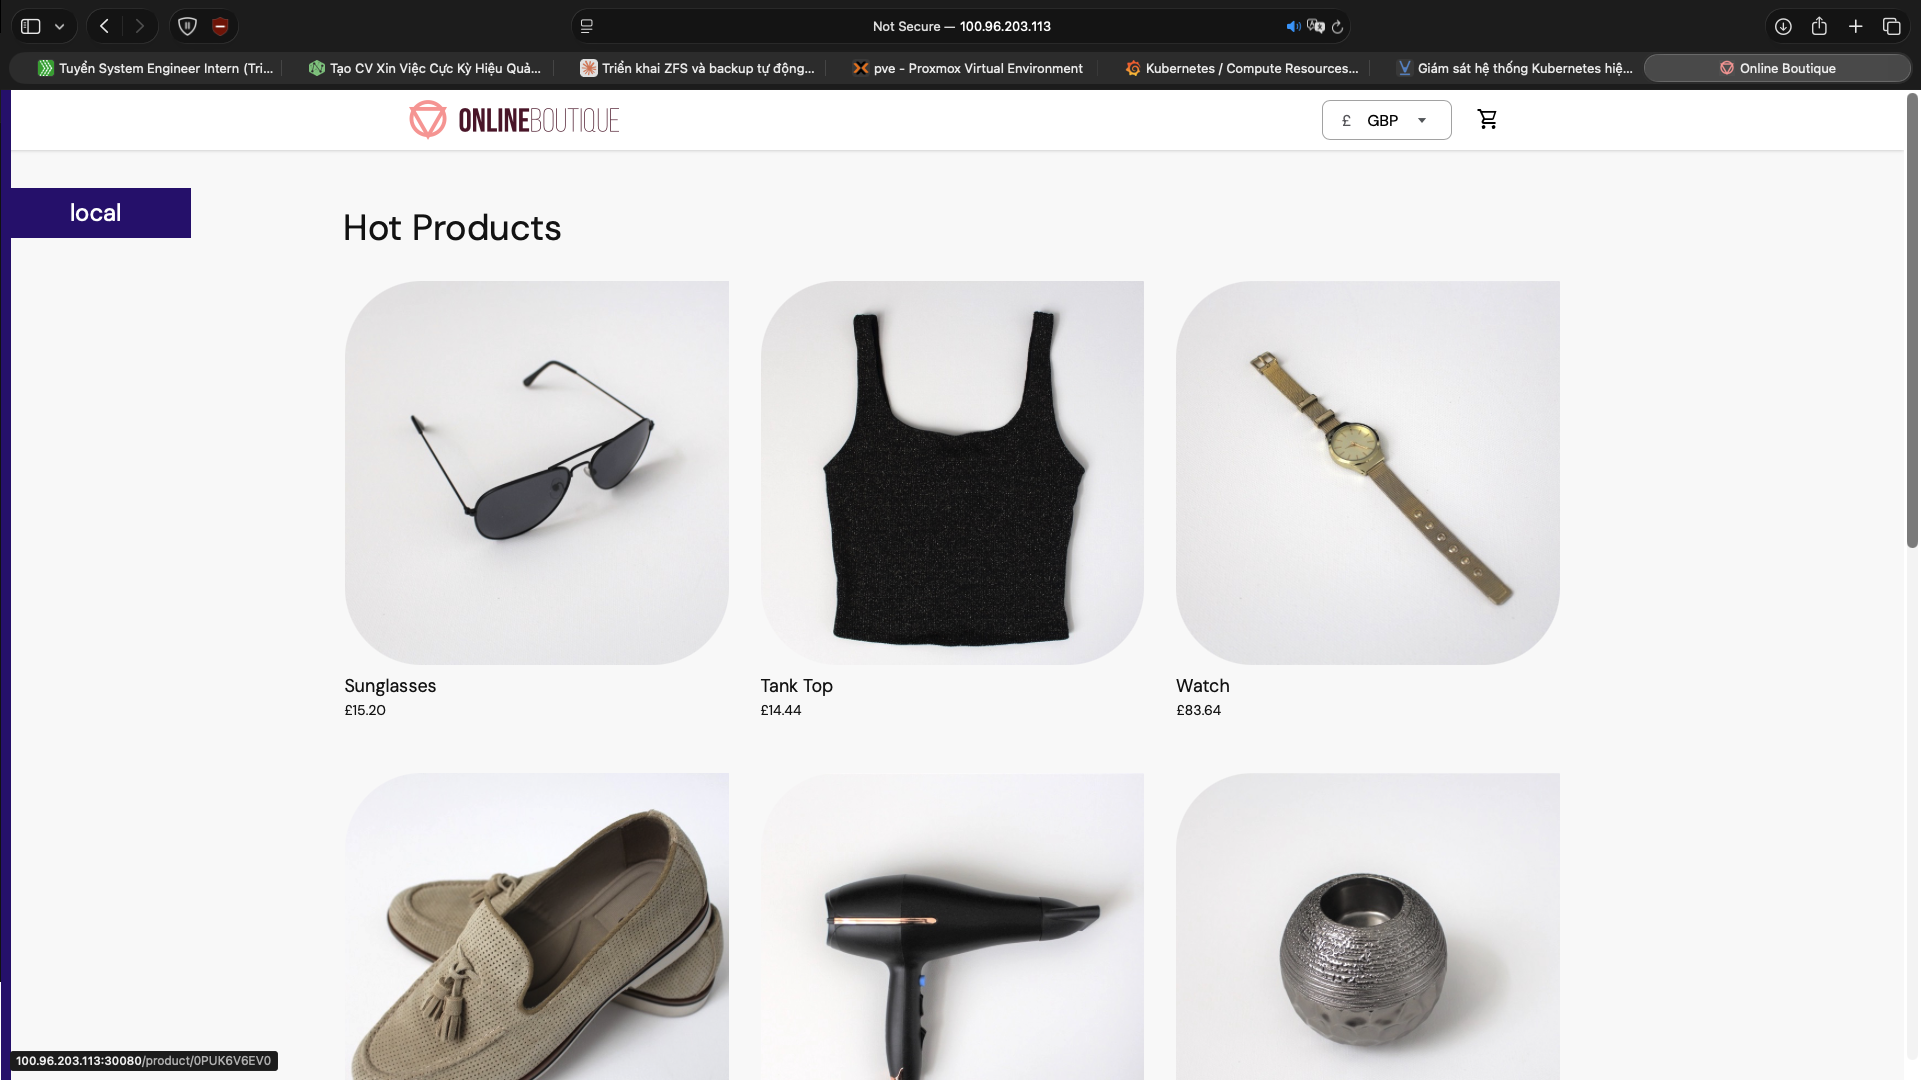 *Google Online Boutique - 11 microservices with gRPC communication*
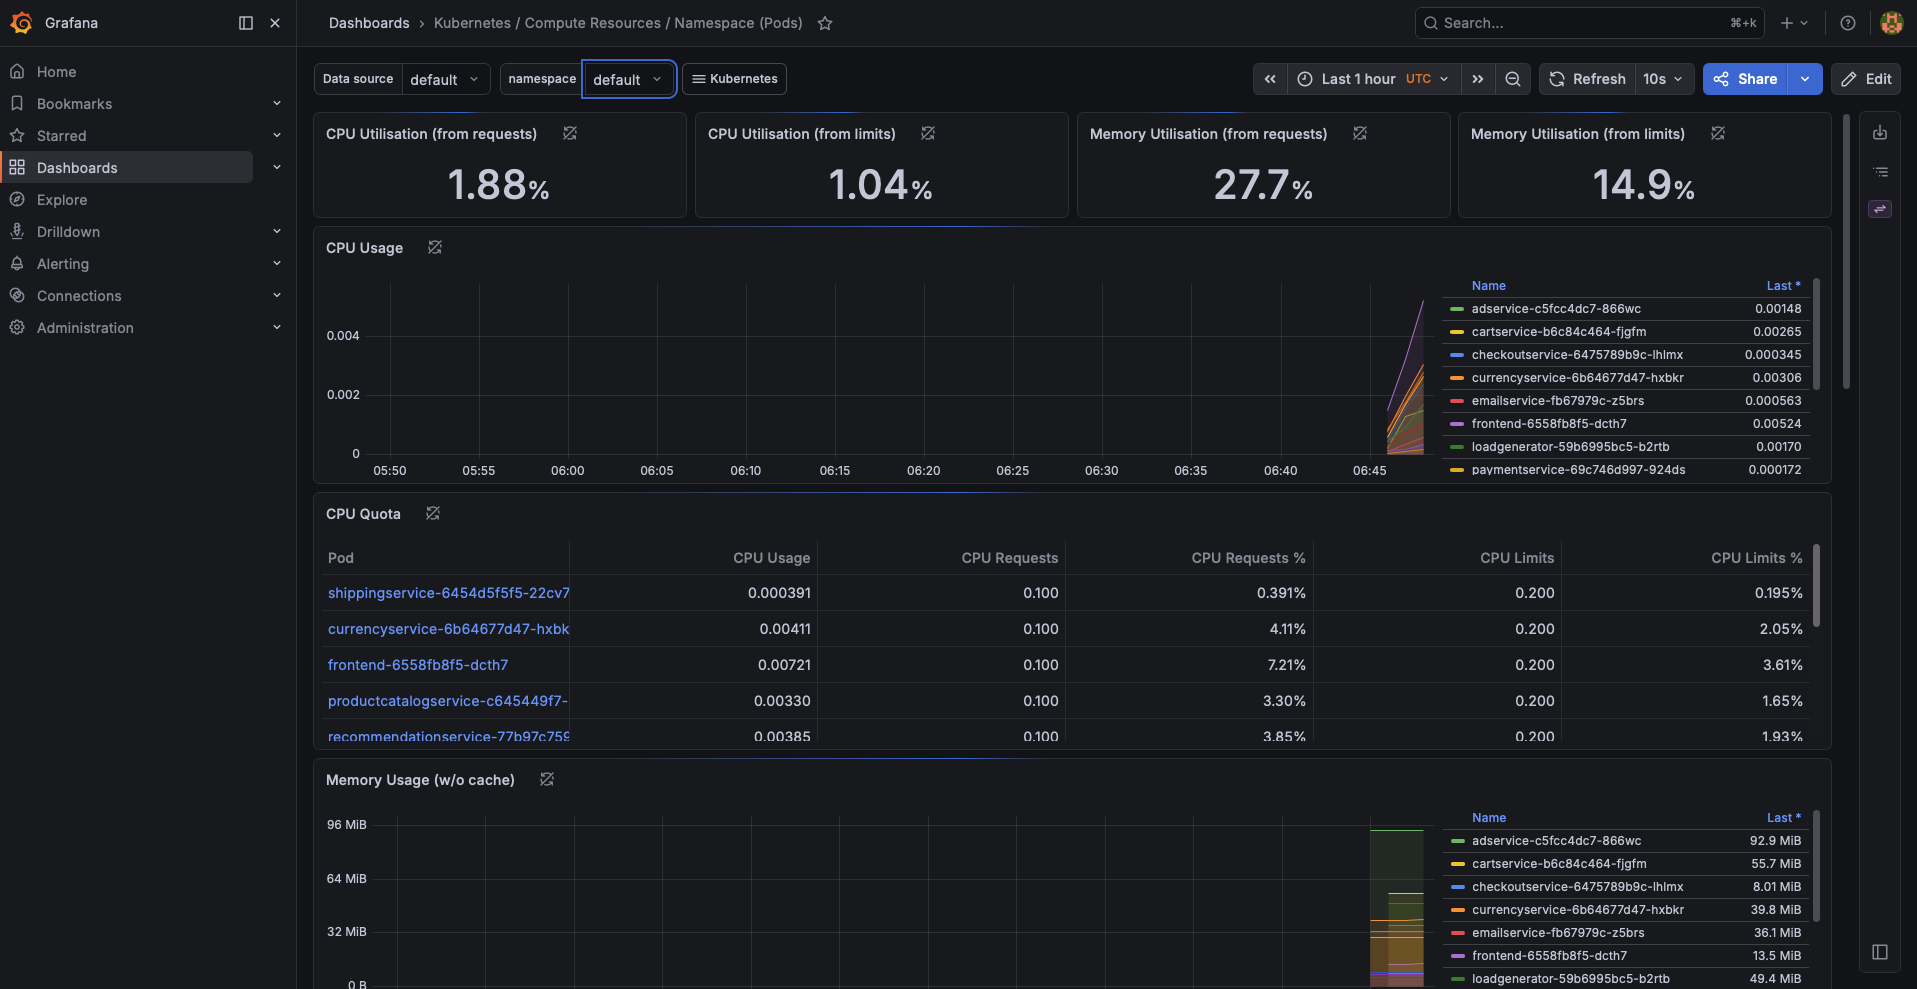 *Prometheus + Grafana monitoring: CPU, Memory, Network I/O metrics*
>> Home
Comments